{{parent.title}}
 Login
Login

Two-thirds (69%) of Bachelor’s degree recipients in the class of 2019 graduated with federal and private student loans, an average of $29,900 per borrower. The mean student loan debt among all Bachelor’s degree recipients, including those who did not borrow, was $20,600.
These figures include federal and private student loans, but not parent loans. The average parent loan debt was $37,200 among the 14% of parents of Bachelor’s degree recipients who borrowed to pay for their student’s college education. It does not include parent loans borrowed for other children.
Note that the term average debt at graduation refers to the average among just the students who graduated with debt. The mean debt at graduation for Bachelor’s degree recipients, which is the average among all students who graduated with a Bachelor’s degree (including those who graduated with no debt) is $20,600. This is the same as the product of the average debt figure with the percentage who graduated with debt. For example, $29,900 x 69% = $20,600.
Average debt at graduation for Bachelor’s degree recipients varies depending on the type of college. The average debt at graduation for Bachelor’s degree recipients was $27,700 at public colleges (68% borrowing), $30,800 at private non-profit colleges (66% borrowing) and $41,000 at private for-profit colleges (85% borrowing).
Average Debt at Graduation for Other Degree Levels
The average debt at graduation for Associate’s degree recipients was $19,600, with 47% borrowing.
The average debt at graduation for Certificate recipients was $17,400, with 67% borrowing.
Overall, the average graduate student debt at graduation for graduate degree recipients is $66,000, with 56% borrowing. This does not include outstanding undergraduate debt, which brings the average debt at graduation to $71,300, with 73% borrowing. The average graduate student debt at graduation varies significantly by degree level and field of study.
- Master’s degrees $44,900 (54%)
- MBA $52,600 (47%)
- MSW $82,300 (88%)
- PhD $107,500 (47%)
- Law (LLB or JD) $113,300 (62%)
- Medicine (MD) $223,700 (84%)
The growth in average student debt at graduation has slowed for Bachelor’s degree recipients, but not the recipients of Associate’s degrees, Certificates or graduate degrees, as Bachelor’s degree recipients have approached undergraduate Federal Direct Stafford loan limits. This has contributed to a shift in borrowing from student debt to parent debt for Bachelor’s degree recipients but not for other degrees, yielding a significant increase in average parent loan debt at graduation for Bachelor’s degree recipients.
Historical Average Debt at Graduation Statistics
This table shows historical figures for average debt at graduation and the percentage graduating with student loans for recipients of Bachelor’s degrees, Associate’s Degrees and Certificates. It also includes historical figures for the average parent loan debt at graduation for Bachelor’s degree recipients. These figures are not adjusted for inflation.
Year |
Bachelor’s Degrees |
Associate’s Degrees |
Certificates |
Parents of Bachelor’s |
2018-19 |
$29,900 (69%) |
$19,600 (47%) |
$17,400 (67%) |
$37,200 (14%) |
2017-18 |
$29,800 (69%) |
$19,200 (47%) |
$16,800 (67%) |
$35,600 (14%) |
2016-17 |
$29,700 (69%) |
$18,900 (48%) |
$16,100 (67%) |
$34,100 (14%) |
2015-16 |
$29,700 (69%) |
$18,500 (48%) |
$15,500 (67%) |
$32,600 (14%) |
2014-15 |
$29,600 (69%) |
$18,200 (48%) |
$14,900 (66%) |
$31,200 (15%) |
2013-14 |
$29,500 (69%) |
$17,800 (49%) |
$14,400 (66%) |
$29,900 (15%) |
2012-13 |
$29,500 (69%) |
$17,500 (49%) |
$13,800 (66%) |
$28,600 (15%) |
2011-12 |
$29,400 (69%) |
$17,200 (50%) |
$13,300 (66%) |
$27,400 (16%) |
2010-11 |
$27,700 (68%) |
$16,100 (49%) |
$12,700 (65%) |
$26,300 (15%) |
2009-10 |
$26,100 (68%) |
$15,000 (49%) |
$12,100 (65%) |
$25,200 (15%) |
2008-09 |
$24,600 (67%) |
$14,100 (48%) |
$11,600 (64%) |
$24,200 (14%) |
2007-08 |
$23,200 (67%) |
$13,200 (48%) |
$11,100 (63%) |
$23,300 (14%) |
2006-07 |
$22,000 (66%) |
$12,400 (45%) |
$10,100 (60%) |
$21,200 (13%) |
2005-06 |
$20,800 (65%) |
$11,600 (42%) |
$9,200 (58%) |
$19,300 (12%) |
2004-05 |
$19,700 (65%) |
$10,900 (39%) |
$8,400 (56%) |
$17,600 (11%) |
2003-04 |
$18,600 (64%) |
$10,300 (36%) |
$7,600 (53%) |
$16,000 (10%) |
2002-03 |
$18,300 (64%) |
$10,100 (37%) |
$7,700 (51%) |
$15,600 (10%) |
2001-02 |
$17,900 (63%) |
$9,800 (38%) |
$7,700 (48%) |
$15,200 (10%) |
2000-01 |
$17,600 (63%) |
$9,600 (38%) |
$7,700 (45%) |
$14,700 (10%) |
1999-00 |
$17,300 (62%) |
$9,400 (39%) |
$7,800 (43%) |
$14,400 (10%) |
1998-99 |
$16,000 (61%) |
$8,300 (39%) |
$7,100 (45%) |
$12,600 (9%) |
1997-98 |
$14,900 (60%) |
$7,300 (39%) |
$6,500 (46%) |
$11,100 (9%) |
1996-97 |
$13,800 (59%) |
$6,400 (40%) |
$5,900 (48%) |
$9,800 (8%) |
1995-96 |
$12,800 (58%) |
$5,700 (40%) |
$5,400 (50%) |
$8,600 (8%) |
1994-95 |
$11,500 (54%) |
$5,500 (38%) |
$5,200 (46%) |
$7,800 (7%) |
1993-94 |
$10,300 (49%) |
$5,300 (36%) |
$5,000 (43%) |
$7,000 (7%) |
1992-93 |
$9,300 (46%) |
$5,100 (35%) |
$4,800 (40%) |
$6,400 (6%) |
Over the last decade, average debt at graduation has increased by 21% for Bachelor’s degree recipients, by 39% for Associate’s degree recipients, by 50% for Certificate recipients and by 53% for parents.
Over the last two decades, average debt at graduation has increased by 86% for Bachelor’s degree recipients, by 136% for Associate’s degree recipients, by 146% for Certificate recipients and by 194% for parents.
This chart shows historical average debt at graduation for Bachelor’s degree recipients.
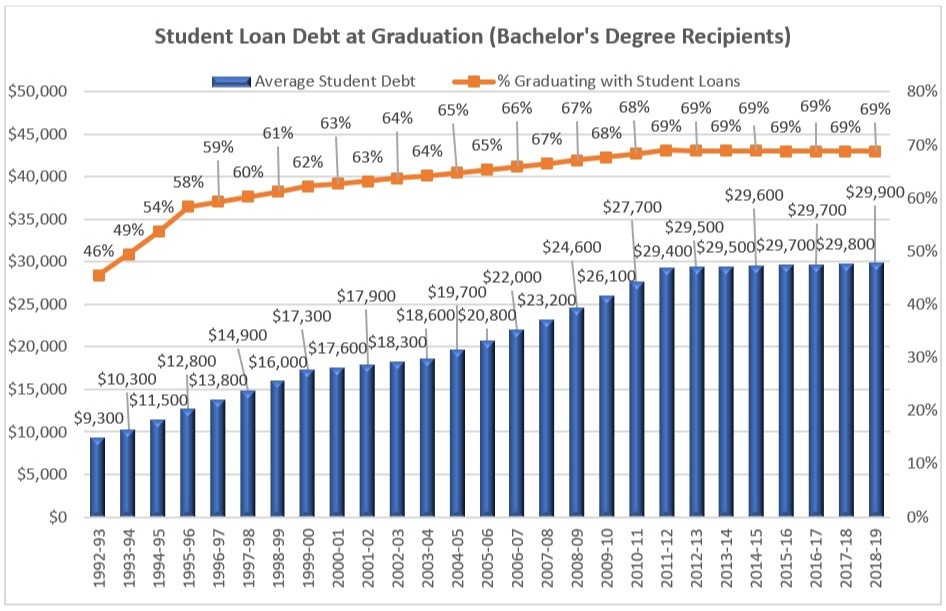
The figures concerning average student debt at graduation are based on an analysis by Mark Kantrowitz of data from the 1992-1993, 1995-1996, 1999-2000, 2003-2004, 2007-2008, 2011-2012 and 2015-2016 National Postsecondary Student Aid Study (NPSAS), with geometric interpolation and projection in between NPSAS years.
Impact of Number of Years in College on Amount of Debt
Some students take more than four years to graduate with a Bachelor’s degree. This table shows the impact of time to completion on the amount of student debt at graduation for Bachelor’s degree recipients and the percentage graduating with student loan debt, based on data from the 2015-2016 NPSAS.
Average Debt at Graduation By Number of Years in College |
4 years |
5 years |
Public |
$27,082 (65.0%) |
$32,085 (81.5%) |
Private Non-Profit |
$32,239 (67.5%) |
$35,694 (83.1%) |
Private For-Profit |
$43,940 (85.2%) |
$45,930 (97.3%) |
Overall |
$30,043 (67.1%) |
$34,569 (83.4%) |
Thus, even if it takes students at public colleges an extra year to graduate, as compared with students at private non-profit colleges, they still graduate with less debt, on average.
Average Number of Student Loans per Borrower
Of undergraduate students who borrow federal student loans to pay for a Bachelor’s degree, more than 95% borrow for at least four years.
On average, 85% of undergraduate students who borrowed a subsidized Federal Direct Stafford loan also borrowed an unsubsidized subsidized Federal Direct Stafford loan, based on data from the 2015-2016 NPSAS. Likewise, 85% of undergraduate students who borrowed an unsubsidized Federal Direct Stafford loan also borrowed a subsidized Federal Direct Stafford loan.
Thus, the typical student who borrows for a Bachelor’s degree will graduate with 7.5 or more Federal Direct Stafford loans, including both subsidized and unsubsidized loans.
About 11% also borrow institutional or private student loans and about 6% borrow institutional or private student loans without federal student loans. That brings the average number of student loans to 8.2 loans.
Thus, the typical number of student loans at graduation with a Bachelor’s degree will range from 8 to 12. This does not count Federal Parent PLUS loans.
Monthly Average Student Loan Payment
According to the Federal Reserve Board’s Report on the Economic Well-Being of U.S. Households (2017, 2018), the average monthly student loan payment in 2016 was $393 and the median payment was $222. These figures are based on the Survey of Household Economics and Decision-making (SHED). SHED also reported that “individuals who either did not complete their degree or who attended a for-profit institution are disproportionately likely to fall behind on their student loan payments.”
What is the average student loan debt?
Based on data from the 2012 follow-up to the 2007-08 Baccalaureate & Beyond longitudinal study (B&B:08/12), among Bachelor’s degree recipients in 2007-08 who were still repaying their student loans in 2012, the average monthly student loan payment was $346 and the median payment was $250.
This compares with an average car loan payment of $411 among Bachelor’s degree recipients ($405 among those with student loan payments).
The 2017 follow-up to the 2015-16 Baccalaureate & Beyond longitudinal study (B&B:16/17), provides updated and more detailed data. The average student loan payment was $305 and the median was $240. For federal student loans, the average loan payment was $244 and the median was $215. For private student loans, the average loan payment was $383 and the median was $300. This compares with an average car loan payment of $392 and a median of $340.
According to the 2009 follow-up to the 2003-04 Beginning Postsecondary Students longitudinal study (BPS:04/09), the average monthly student loan payment among Bachelor’s degree recipients was $254 and the median payment was $200. This compares with an average monthly student loan payment of $139 among college dropouts, with a median payment of $100.
For comparison, the monthly student loan payment on $30,000 in student loan debt at 5% interest with a 10-year term is $318 per month.
Average Student Loan Repayment Term
The average repayment term for federal student loans is 16 years, as of December 31, 2018.
The Federal Direct Loan Portfolio by Repayment Plan spreadsheet provides data concerning the total student loan dollars and number of borrowers in each repayment plan in the Direct Loan program.
Assuming the maximum repayment term for each repayment plan, the average repayment term is 15.5 years when weighted by the number of borrowers. This assumes a maximum of 25 years in extended and graduated repayment plans. The average amount of debt in each repayment plan is consistent with the 25-year repayment term.
If one assumes a maximum of 30 years instead, which would require consolidating the loans, the average repayment term is 15.9 years when weighted by the number of borrowers.
The average repayment term has been increasing over time, as average debt has increased. The average repayment term was 14.4 years five years ago.
Note that these figures are a ceiling, based on the maximum term in the current repayment plan for borrowers in repayment. Borrowers have a tendency to choose the repayment plan with the lowest monthly payment, which corresponds to the longest repayment term, since it “saves” money in their monthly budget.
It is possible that some borrowers are in repayment for a longer term if the borrowers switch repayment plans or choose deferments and forbearances. It is also possible that some borrowers pay off the last year or two of the repayment plan in one big lump sum.
Pell Grant Recipients Graduate with More Student Loan Debt
As illustrated in these charts, Federal Pell Grant recipients are more likely to graduate with student loan debt and with more student loan debt than non-recipients. This data is based on the 2015-2016 NPSAS.
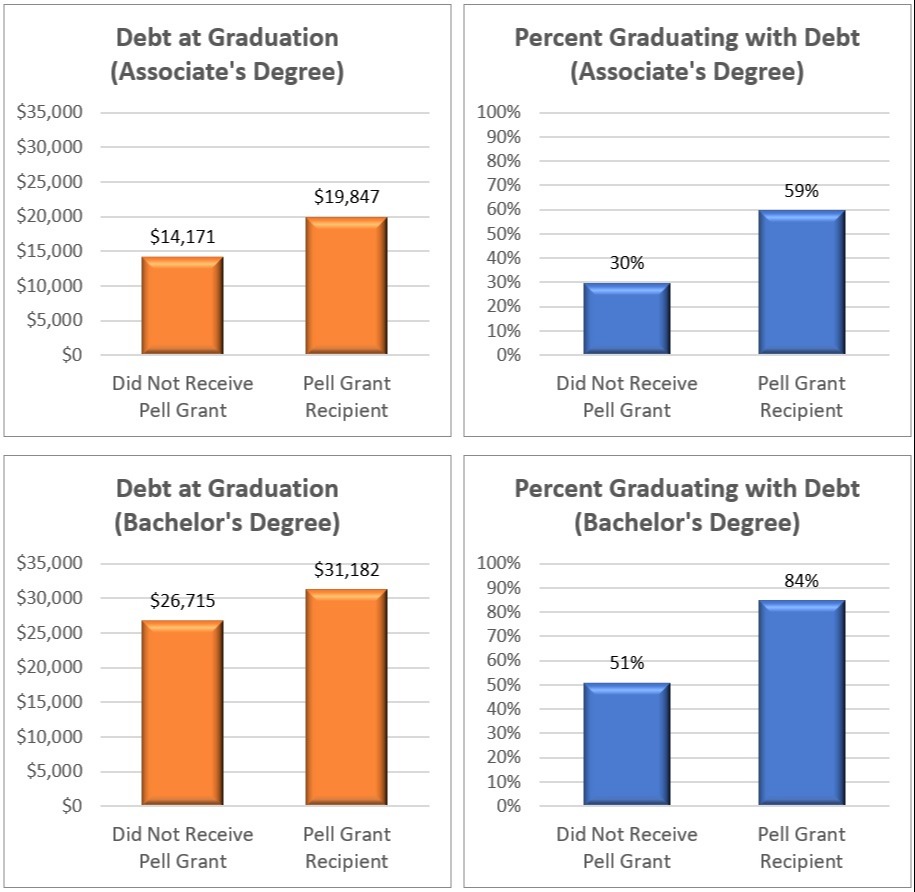
Among Associate’s degree recipients, students who have received a Pell Grant are twice (99%) as likely to graduate with student loan debt. The average debt at graduation is $5,676 (40%) greater.
Among Bachelor’s degree recipients, students who have received a Pell Grant are two-thirds (67%) more likely to graduate with student loan debt. The average debt at graduation is $4,466 (17%) greater.
Six Figure Student Loan Debt
This table shows the percentage of federal student loans outstanding by the amount of debt using data from the FSA Data Center.
Amount of Federal Debt |
% of Dollars |
% of Borrowers |
Less than $5,000 |
1.6% |
19.1% |
$5,000 to $9,999 |
3.8% |
16.7% |
$10,000 to $19,999 |
9.3% |
20.4% |
$20,000 to $39,999 |
18.4% |
20.7% |
$40,000 to $59,999 |
13.7% |
9.0% |
$60,000 to $79,999 |
11.6% |
5.3% |
$80,000 to $99,999 |
7.6% |
2.6% |
$100,000 to $199,999 |
19.5% |
4.6% |
$200,000 or more |
14.6% |
1.5% |
Summing the last two rows of the table for each quarter yields the percentage of borrowers with outstanding federal student loans in the six figures. This includes not just borrowers who graduated with six figure debt, but also borrowers whose debt has increased after graduation, often due to an extended period of non-payment.
Six-Figure Federal Student Loan Debt By Year |
% of Dollars |
% of Borrowers |
2017 Q2 |
30.8% |
5.4% |
2017 Q3 |
31.2% |
5.4% |
2017 Q4 |
31.7% |
5.6% |
2018 Q1 |
32.1% |
5.5% |
2018 Q2 |
32.7% |
6.0% |
2018 Q3 |
33.2% |
6.0% |
2018 Q4 |
33.7% |
6.0% |
2019 Q1 |
34.1% |
6.2% |
This chart shows the number of students graduating with six-figure student loan debt, based on data from the National Postsecondary Student Aid Study (NPSAS). It includes both federal and private student loan debt, but not parent loan debt.
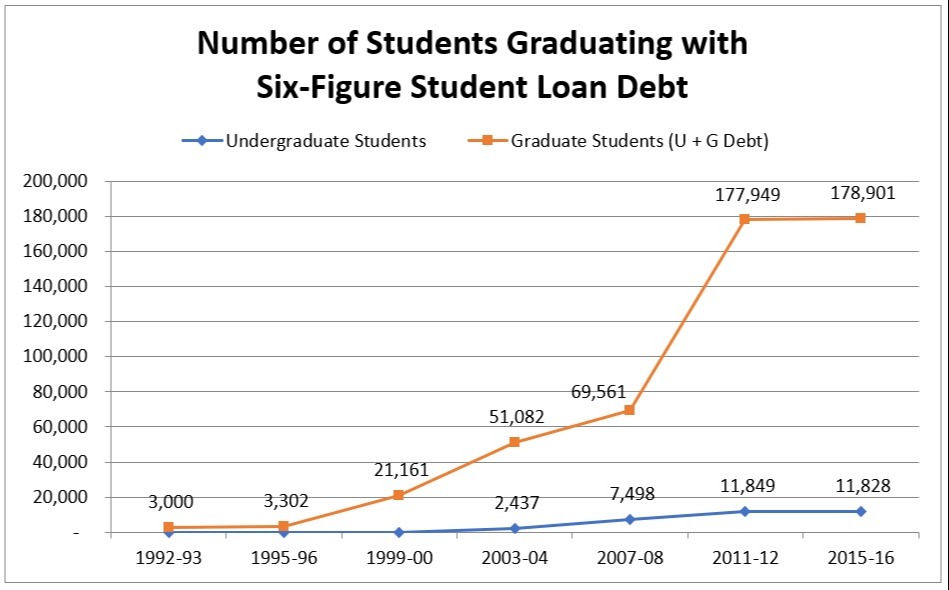
As can be seen from the chart, more than 90% of borrowers graduating with six-figure student loan debt are graduate students, not undergraduate students.
This table, which is based on the 2015-16 NPSAS, shows the percentile distribution of student loan debt at graduation for undergraduate and graduate students who graduate with student loan debt. Thus, nearly 90% of all undergraduate students graduate with $50,000 or less in student loan debt. If one includes students who graduate with no debt, the same is true of Bachelor’s degree recipients, where the 90th percentile is $50,343.
Degree Level |
10th |
25th |
50th |
75th |
90th |
Certificate |
$4,360 |
$7,063 |
$11,250 |
$19,509 |
$31,503 |
Associate’s Degree |
$3,274 |
$6,500 |
$15,005 |
$26,363 |
$38,832 |
Bachelor’s Degree |
$6,500 |
$15,313 |
$27,000 |
$40,130 |
$56,017 |
All Undergraduates |
$4,914 |
$9,795 |
$20,809 |
$33,325 |
$50,035 |
Master’s Degree |
$9,900 |
$19,169 |
$35,250 |
$57,238 |
$86,000 |
MBA |
$6,200 |
$19,567 |
$38,021 |
$61,500 |
$97,137 |
MSW |
$16,350 |
$27,663 |
$55,187 |
$80,720 |
$117,763 |
PhD |
$11,175 |
$34,035 |
$68,978 |
$116,341 |
$178,570 |
Law (LLB or JD) |
$38,000 |
$61,500 |
$108,450 |
$167,408 |
$217,000 |
Medicine |
$50,000 |
$119,460 |
$176,464 |
$274,637 |
$331,260 |
Dentistry |
$144,010 |
$148,321 |
$230,778 |
$352,206 |
$413,357 |
Pharmacy |
$27,343 |
$30,750 |
$68,250 |
$130,717 |
$206,161 |
Based on the 2015-16 NPSAS, 0.5% of Bachelor’s degree recipients graduated with $100,000 or more in federal and private student loan debt, not including parent loans. Similarly, 0.8% of parents of Bachelor’s degree recipients borrowed $100,000 or more in Federal Parent PLUS loans for their child’s undergraduate education. (Note that this is the Federal Parent PLUS loan debt for just one child.)
High Net Price Colleges Drive Student Loan Debt at Graduation
The failure of government grants to keep pace with increases in college costs on a per-student, inflation-adjusted basis, shifts the burden of paying for college from the government to the families. But, family income has been flat since the late 1990s, so families are forced to either shift enrollment to lower-cost colleges or to borrow more.
Thus, increases in student loan debt are driven by two components, namely higher college costs and insufficient government grants.
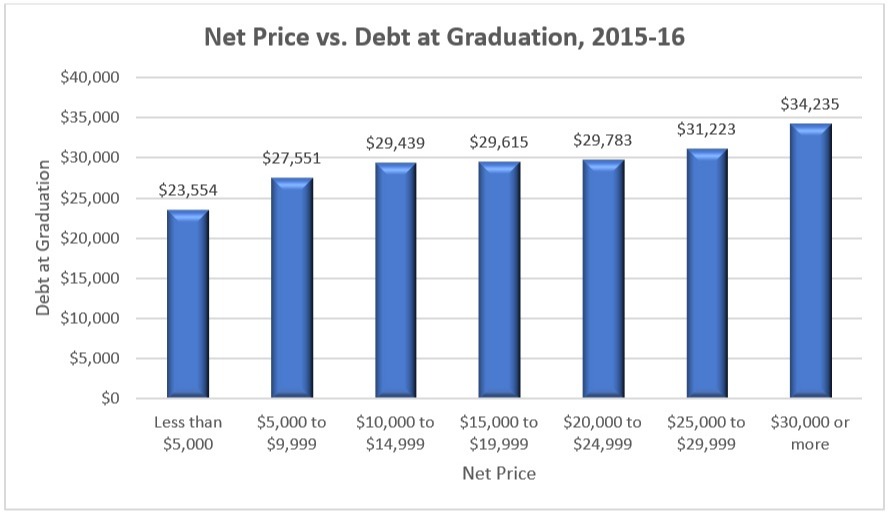
This phenomenon manifests itself in a strong correlation between net price and debt at graduation.
This chart shows the relationship between the one-year net price and student loan debt at graduation, based on the 2015-16 NPSAS. Student loan debt at graduation increases monotonically with increases in the net price. There is a $3,500 increase in student loan debt at graduation for every $10,000 increase in the net price.
There are similar results involving tuition and the cost of attendance, as well as private student loans. Higher college costs lead to higher student loan debt.